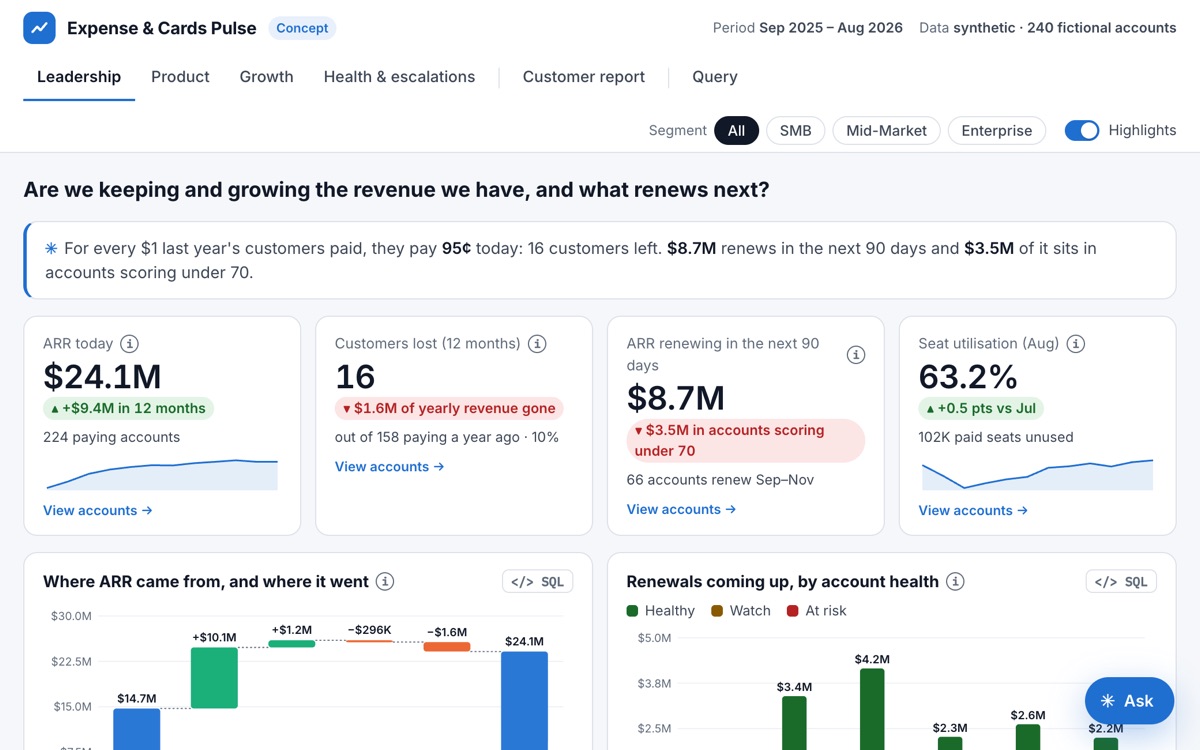
Leadership, product and growth each ask different questions of the same usage data, and each ends up with their own numbers. The dashboard gives all three one clean set of tables and a different view per tab.
What I built
Synthetic but messy. 240 fictional accounts generated the way real usage exports arrive, cleaned in Python, loaded into SQLite.
The SQL behind every chart, runnable in the page, so an analyst can check the work.
A health score with four inputs, weighted so usage dominates, and a list of what I would not trust yet before anyone acts on it.